The total market value of a company can be divided into two parts: the fraction of due to current and short-run foreseeable operations and everything else. Financial economists have used the term “growth options” to describe the everything else. Growth options are the new projects that a company will take in the long-run. Note that many of these projects may not even be envisioned currently. For instance, they could employ new as yet undiscovered technologies. In the year 2000, the iPhone was such a growth option for Apple.
The economic consulting firm, CRA, developed a simple approach for dividing a company’s stock market value into “current” operations and growth options. The value of current operations is calculated as the sum of two parts. The first part is the present value of projected net income over the next five years based on consensus analyst forecasts.[1] The second part is the value of the current operations at the end of the five-year forecast period. To calculate that value CRA assumes that from year six into perpetuity income from the then “current” operations grows at the rate of the overall economy. Notice that this is quite a comprehensive definition of the value of current operations. It includes all the growth expected over the next five years and continued growth along with the economy thereafter. Finally, the value of growth options is defined as the market value equity minus the value of current operations.
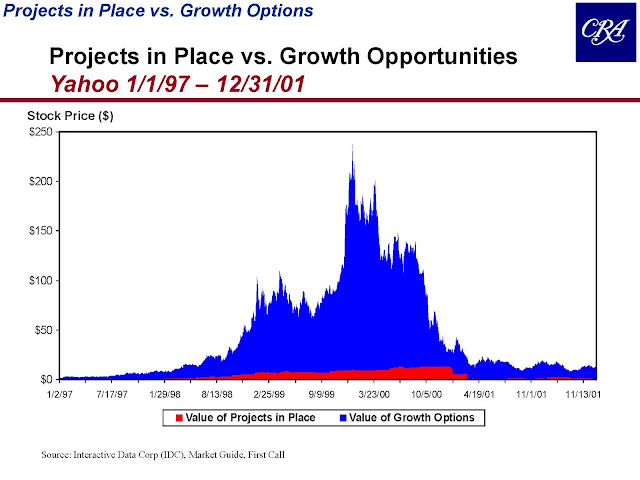
The CRA calculations for two contrasting companies are shown in the exhibits below during the tech boom and collapse from January of 1997 through December of 2001. The first company is Yahoo – a poster child during the tech boom. The exhibit shows that virtually all of the run-up, and subsequent collapse, in the price of Yahoo was due to the changing valuation of growth options. Their value rises from close to zero in 1997 to over $200 per share at the height of the tech boom, before dropping back to about $10 at the end of 2001. In other words, virtually all the rise and fall in the stock price was due changing expectations about future growth more than five years out, rather than changes in current operations. In this regard, there is nothing unique about Yahoo as far as tech companies are concerned. CRA did the same calculations for companies like Cisco, Sun, Microsoft, and eBay and the picture looked the same in every case.
The situation is quite different for what are commonly called value companies. The next exhibit below shows CRA’s calculations for Boeing. For most of the period, virtually all the market value of Boeing is accounted for by current operations. There is no explosion of expectations upward followed by a subsequent collapse.
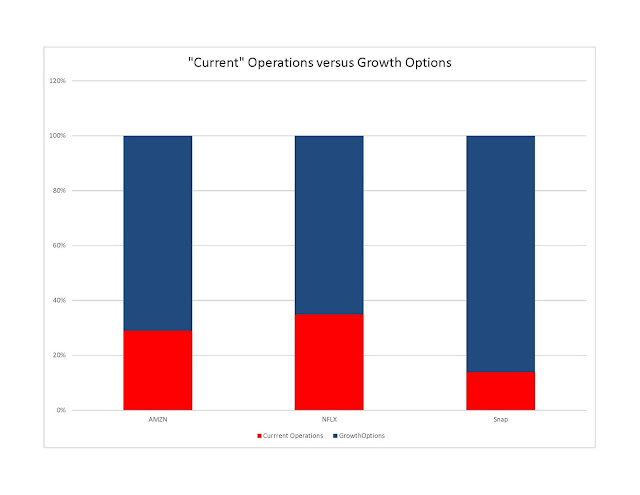
The warning for investors is that enthusiastic expectations regarding growth options, as opposed to current operations, can drive prices up quickly and cause them to collapse at least as fast. Is this an issue to worry about today? To be sure, major tech companies like Amazon and Netflix now have significant value attributable to current operations, but they also have immense market values. So, in relative terms how important are growth options? To provide a few illustrative examples, the exhibit below repeats the CRA calculations for Amazon, Netflix and Snap as of September 2018. The exhibit shows that even in the fulsome way CRA defines it, current operations account for only about 30% of the market value of Amazon and Netflix and just 15% of the value of Snap. This suggests that a change in confidence regarding growth out beyond five years could have a dramatic impact on the stock prices of these and companies whose value is even more dependent on growth options such as Shopify, Spotify, Square, Hubspot and others.


