The Cornell Capital Group Anti Quarantine Index
Tracking the performance of companies most affected by COVID-19 quarantine measures.
In a previous post, I described a new index introduced by the Cornell Capital Group called the CCG Quarantine Index. The index tracks the performance of the stocks that are likely to benefit from the fact that millions of people are more or less confined to their homes during the lockdown. The index is composed of companies such as Amazon, Netflix, Grubhub, Electronic Arts, and Zoom. The index was of sufficient interest that we decided to introduce a counterpart – the CCG Anti-Quarantine Index. The Anti-Quarantine Index focuses on companies in area likely to be particularly hard hit by the lockdown. More specifically, the component companies are drawn from airlines, hotels, cruise lines, live entertainment and movie theaters. Like the CCG Quarantine Index, the CCG Anti-Quarantine Index is equal weighted to avoid placing too much emphasis on large companies.
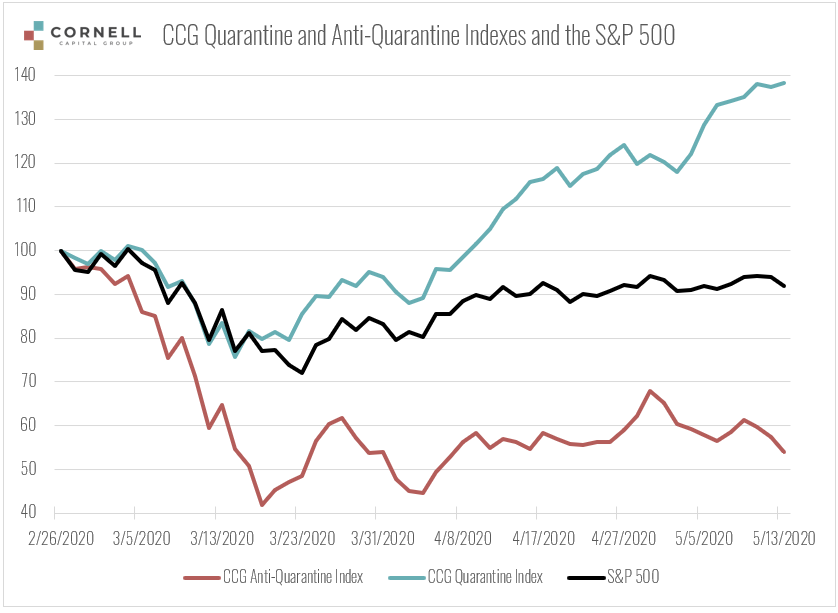
To provide an initial overview, the first chart below plots both the Quarantine and the Anti-Quarantine Index along with the S&P 500 from February 26, 2020 through the close on Friday May 15. Not surprisingly, the Anti-Quarantine Index is almost a mirror image of the Quarantine Index. It falls while the Quarantine Indexes rises as the crisis unfolds. If there is a surprise it is the strength of the Quarantine Index which has risen almost 40% despite the impact of Covid.
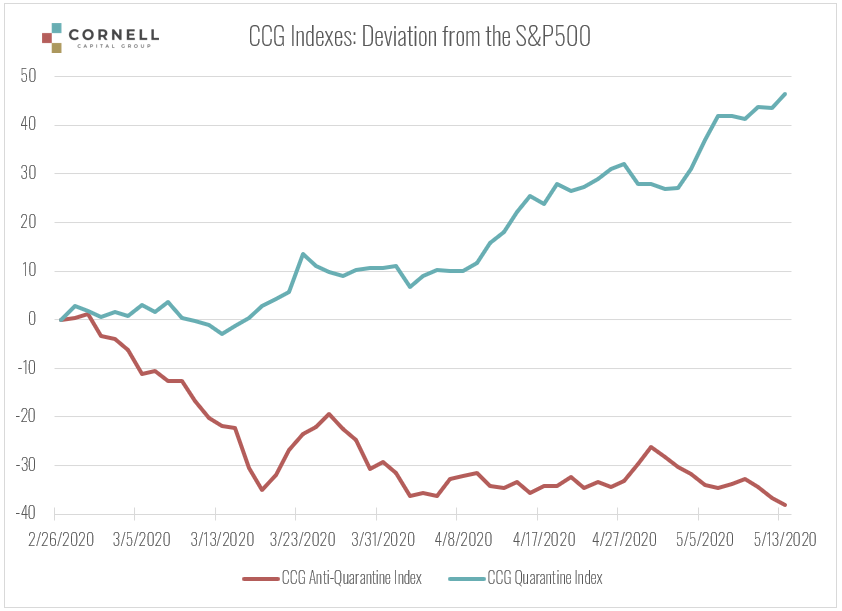
To provide further insight, the second chart below plots the difference between the two quarantine indexes and the S&P 500. In a relatively efficient market, the jiggles of the two differentials should reflect information about the market’s expectation regarding the future of the crisis. For instance, if news were to arrive suggesting that reopening were to occur sooner than previously thought, then all three indexes would be likely to rise, but the anti-quarantine index should rise more than the S&P 500 and the quarantine index should rise less. The reverse would occur if the news implied an unexpected extension of the lockdown.
The relation between the two lines might provide insight into expectations regarding the post virus economy as well. It is possible than even after the introduction of a vaccine; behavioral patterns will be permanently changed. For instance, added constraints at airports, along with rising costs and increased fears, might produce a permanent decline in air travel. Similarly, movie theaters may be permanently disadvantages as compared to home viewing of movies. As information arrives about these possibilities, it should affect the performance of the two CCG Indexes relative to the S&P 500.
Turning to the chart on the deviations of the two CCG Indexes from the S&P 500, provides an interesting surprise. In response to the onset of the crisis, the anti-quarantine index falls relative to the S&P 500 as one would expect. However, by mid-March the relative decline is over, and the anti-quarantine index pretty much follows the market – the deviation remains constant. The quarantine index is quite different. It basically follows the market up through mid-March and then takes off. By mid-May it has risen to a level more than 45 points above the S&P 500. This sharp run-up suggests that as time passed the market became increasing confident that companies in the quarantine index such as Amazon, Zoom and Netflix would be able to exploit changed behavior patterns that would persist long after the virus problem was resolved. On the other hand, it is also possible that the run-up of the quarantine index reflects investor sentiment more extreme than can be justified by the business fundamentals of the component companies. Given such uncertainty, the best bet might be to stay on the sidelines for the time being and see how the two CCG Indexes behave in the next few weeks as steps are taken to reopen the economy.
Live Chart Updated Daily at Close
[tcb-script type=”text/javascript” src=”https://www.gstatic.com/charts/loader.js”\]\[/tcb-script\]\[tcb-script type=”text/javascript”]//—————-chart options go herevar options = {height: 600,width: 1200,chart: {title: ‘CCG Quarantine and Anti Quarantine Indexes vs S&P 500’,subtitle: ‘Path of Wealth’,titleTextStyle: {}},animation: {duration: 1000,easing: ‘out’,startup: true},colors: [‘#46bdc6’, ‘#fbbc04’, ‘#ea4335’]};////’corechart’google.charts.load(‘current’, {‘packages’: [‘line’]});// Set a callback to run when the Google Visualization API is loaded.google.charts.setOnLoadCallback(drawSheetName);// Callback that creates and populates a data table, // instantiates the pie chart, passes in the data and// draws it.function drawSheetName() {var queryString = encodeURIComponent(‘SELECT A, B, D, F’);var query = new google.visualization.Query(‘https://docs.google.com/spreadsheets/d/1LAQ7fMLgB6Xbzvhi4RFDBp0Fw5pqSjciChqWOnFXTNI/gviz/tq?sheet=chartdata&headers=1&tq=’ + queryString);query.send(handleSampleDataQueryResponse);}function handleSampleDataQueryResponse(response) {if (response.isError()) {alert(‘Error in query: ‘ + response.getMessage() + ‘ ‘ + response.getDetailedMessage());return;}var data = response.getDataTable();var chart = new google.charts.Line(document.getElementById(‘chart_div’));chart.draw(data, google.charts.Line.convertOptions(options));}[/tcb-script]