From Liberation Day Chaos to Cautious Recovery The second quarter of 2025 started with the…
Investor Memo Q4 2023: Risk Premiums, Where Art Though (Still)?
A market crash is nothing more than a low risk premium meeting risk aversion.
—– John P. Hussman, Ph.D., November 8, 2021, When Bubble Meets Trouble
Risk Premiums and Stock Prices
In our third quarter memo, we stressed the importance of the equity risk premium (ERP) for understanding the level of stock prices and their relation to expected future returns. We noted that the implied equity premium, as calculated by Professor Aswath Damodaran, was well below its
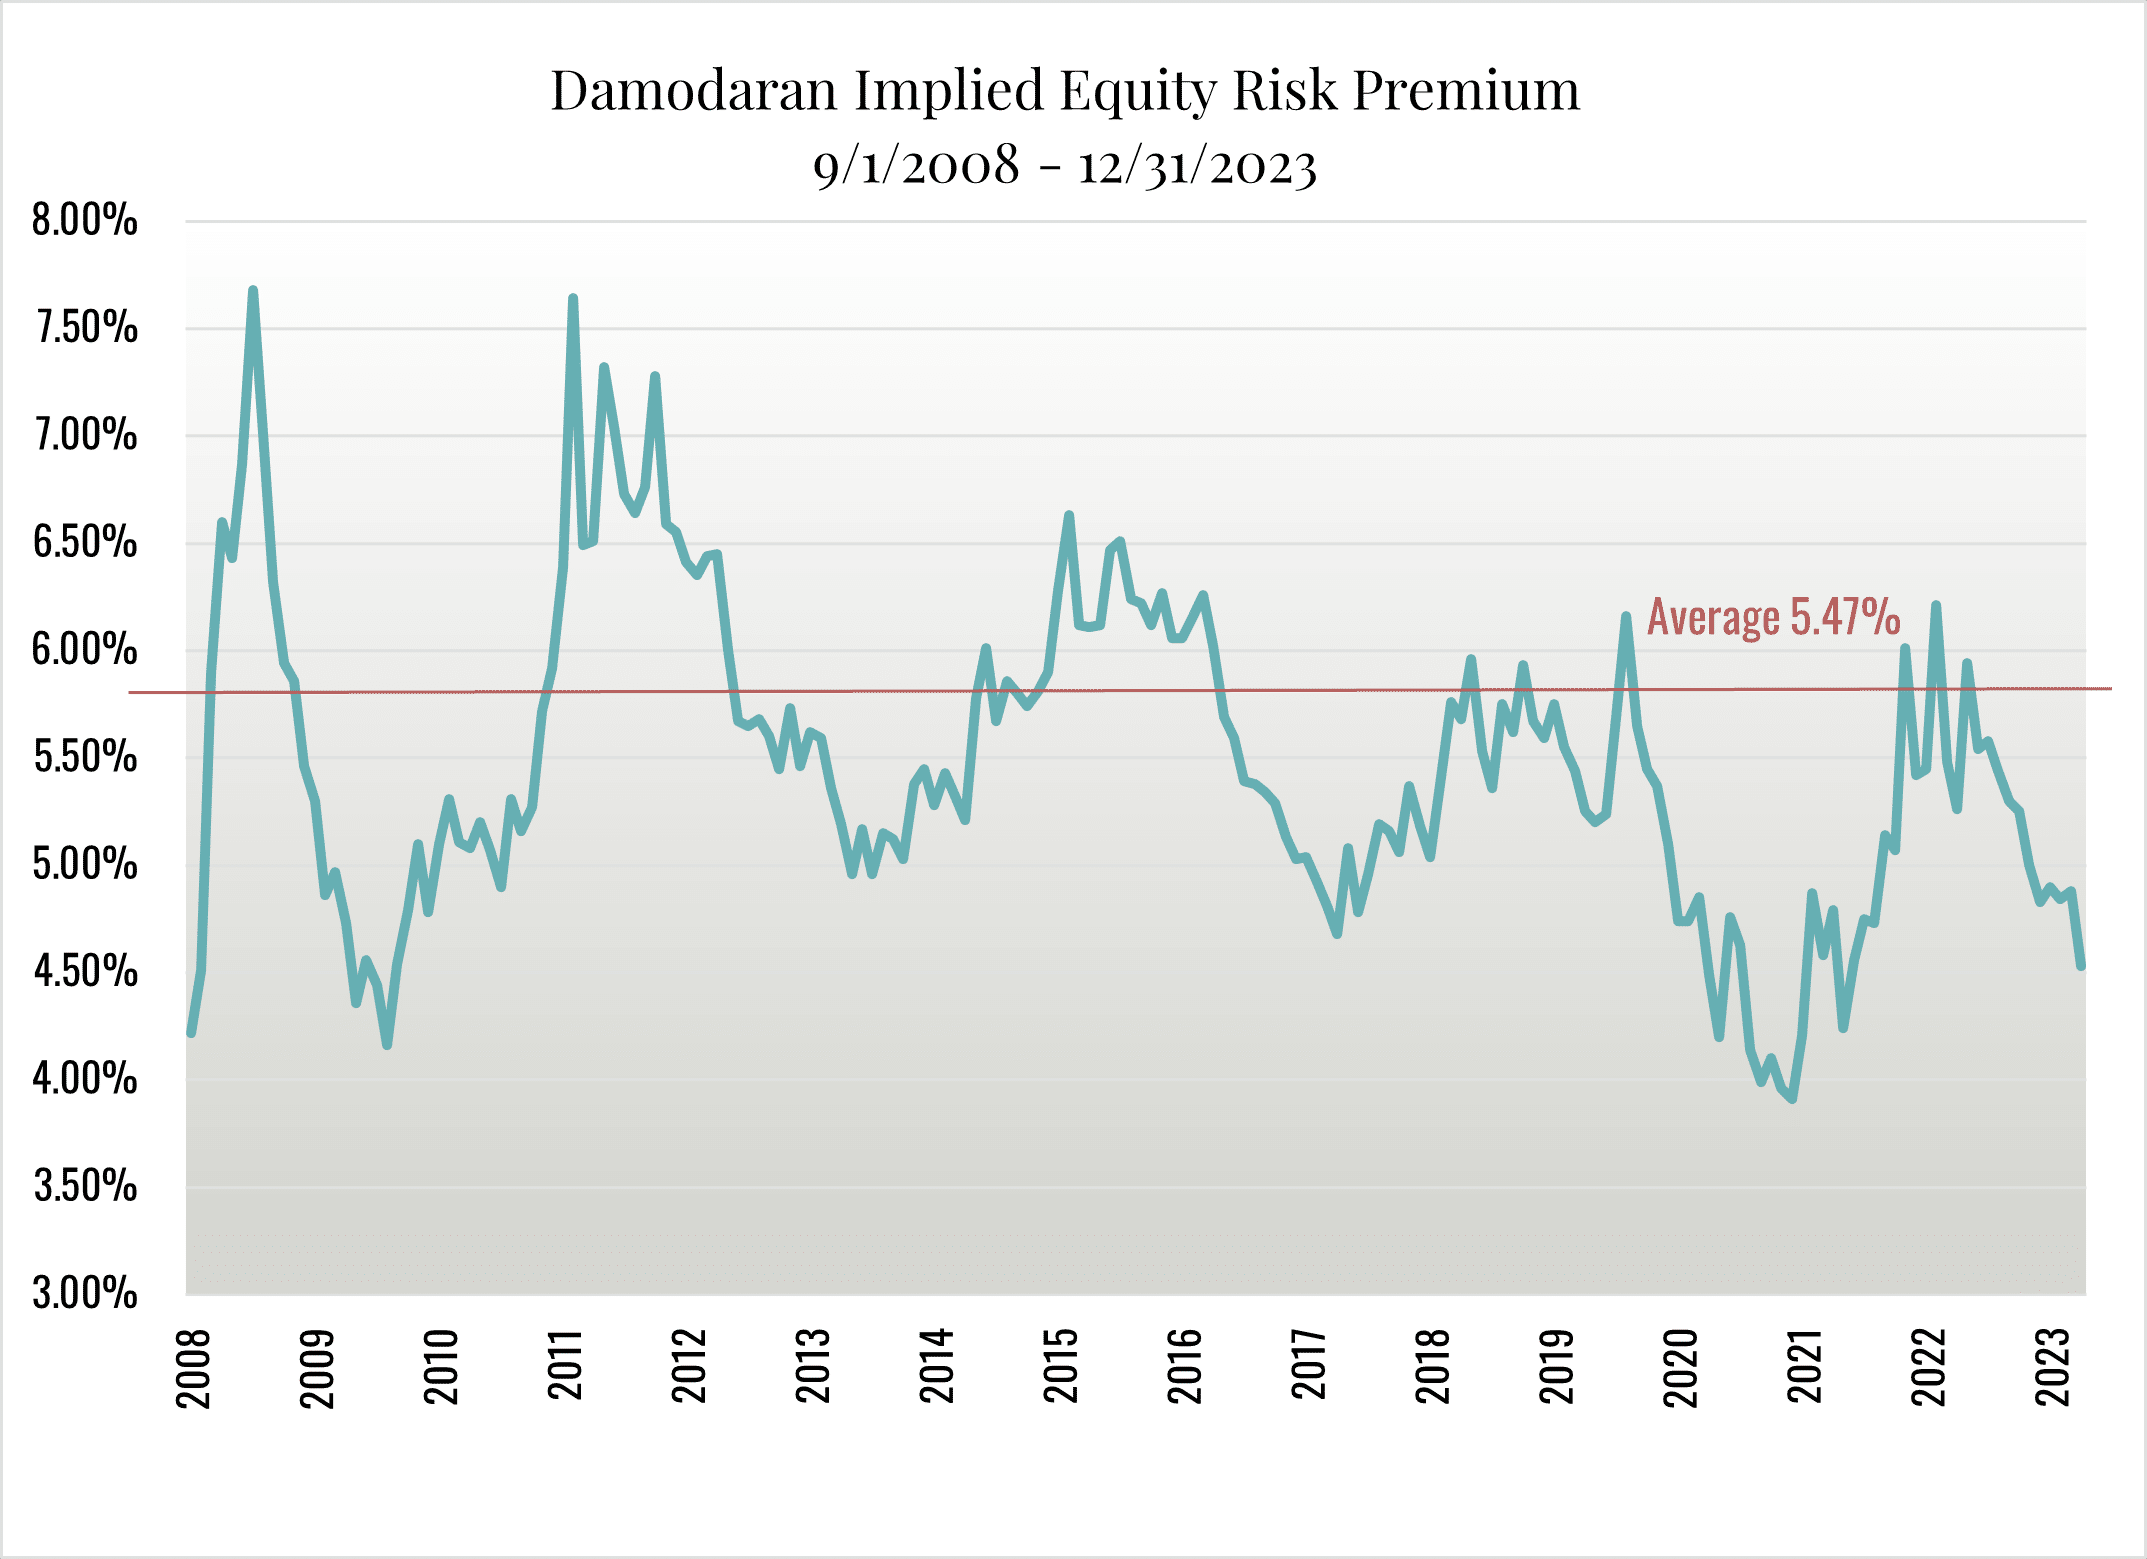
long-run average and produced the chart above which is extended through December 31, 2023. As it shows, the implied equity risk premium fell from 4.84% on October 1, 2023 to 4.53% on December 31, 2023. Only twice in the previous twenty years has it been this low.
We then demonstrated how sensitive the valuation of the S&P 500 is to changes in the risk premium using a valuation model described by Damodaran. It turns out that a falling risk premium not only leads to higher prices, it also leads to greater sensitivity of market prices to further changes in the risk premium as illustrated by the chart below. This sensitivity translates into greater risk. The updated chart shows the impact of changes in the equity risk premium on the valuation of the S&P 500. Notice that if the equity risk premium were to return to its long-run average of 5.47%, the
S&P 500 would drop 18.2% to 3,900.
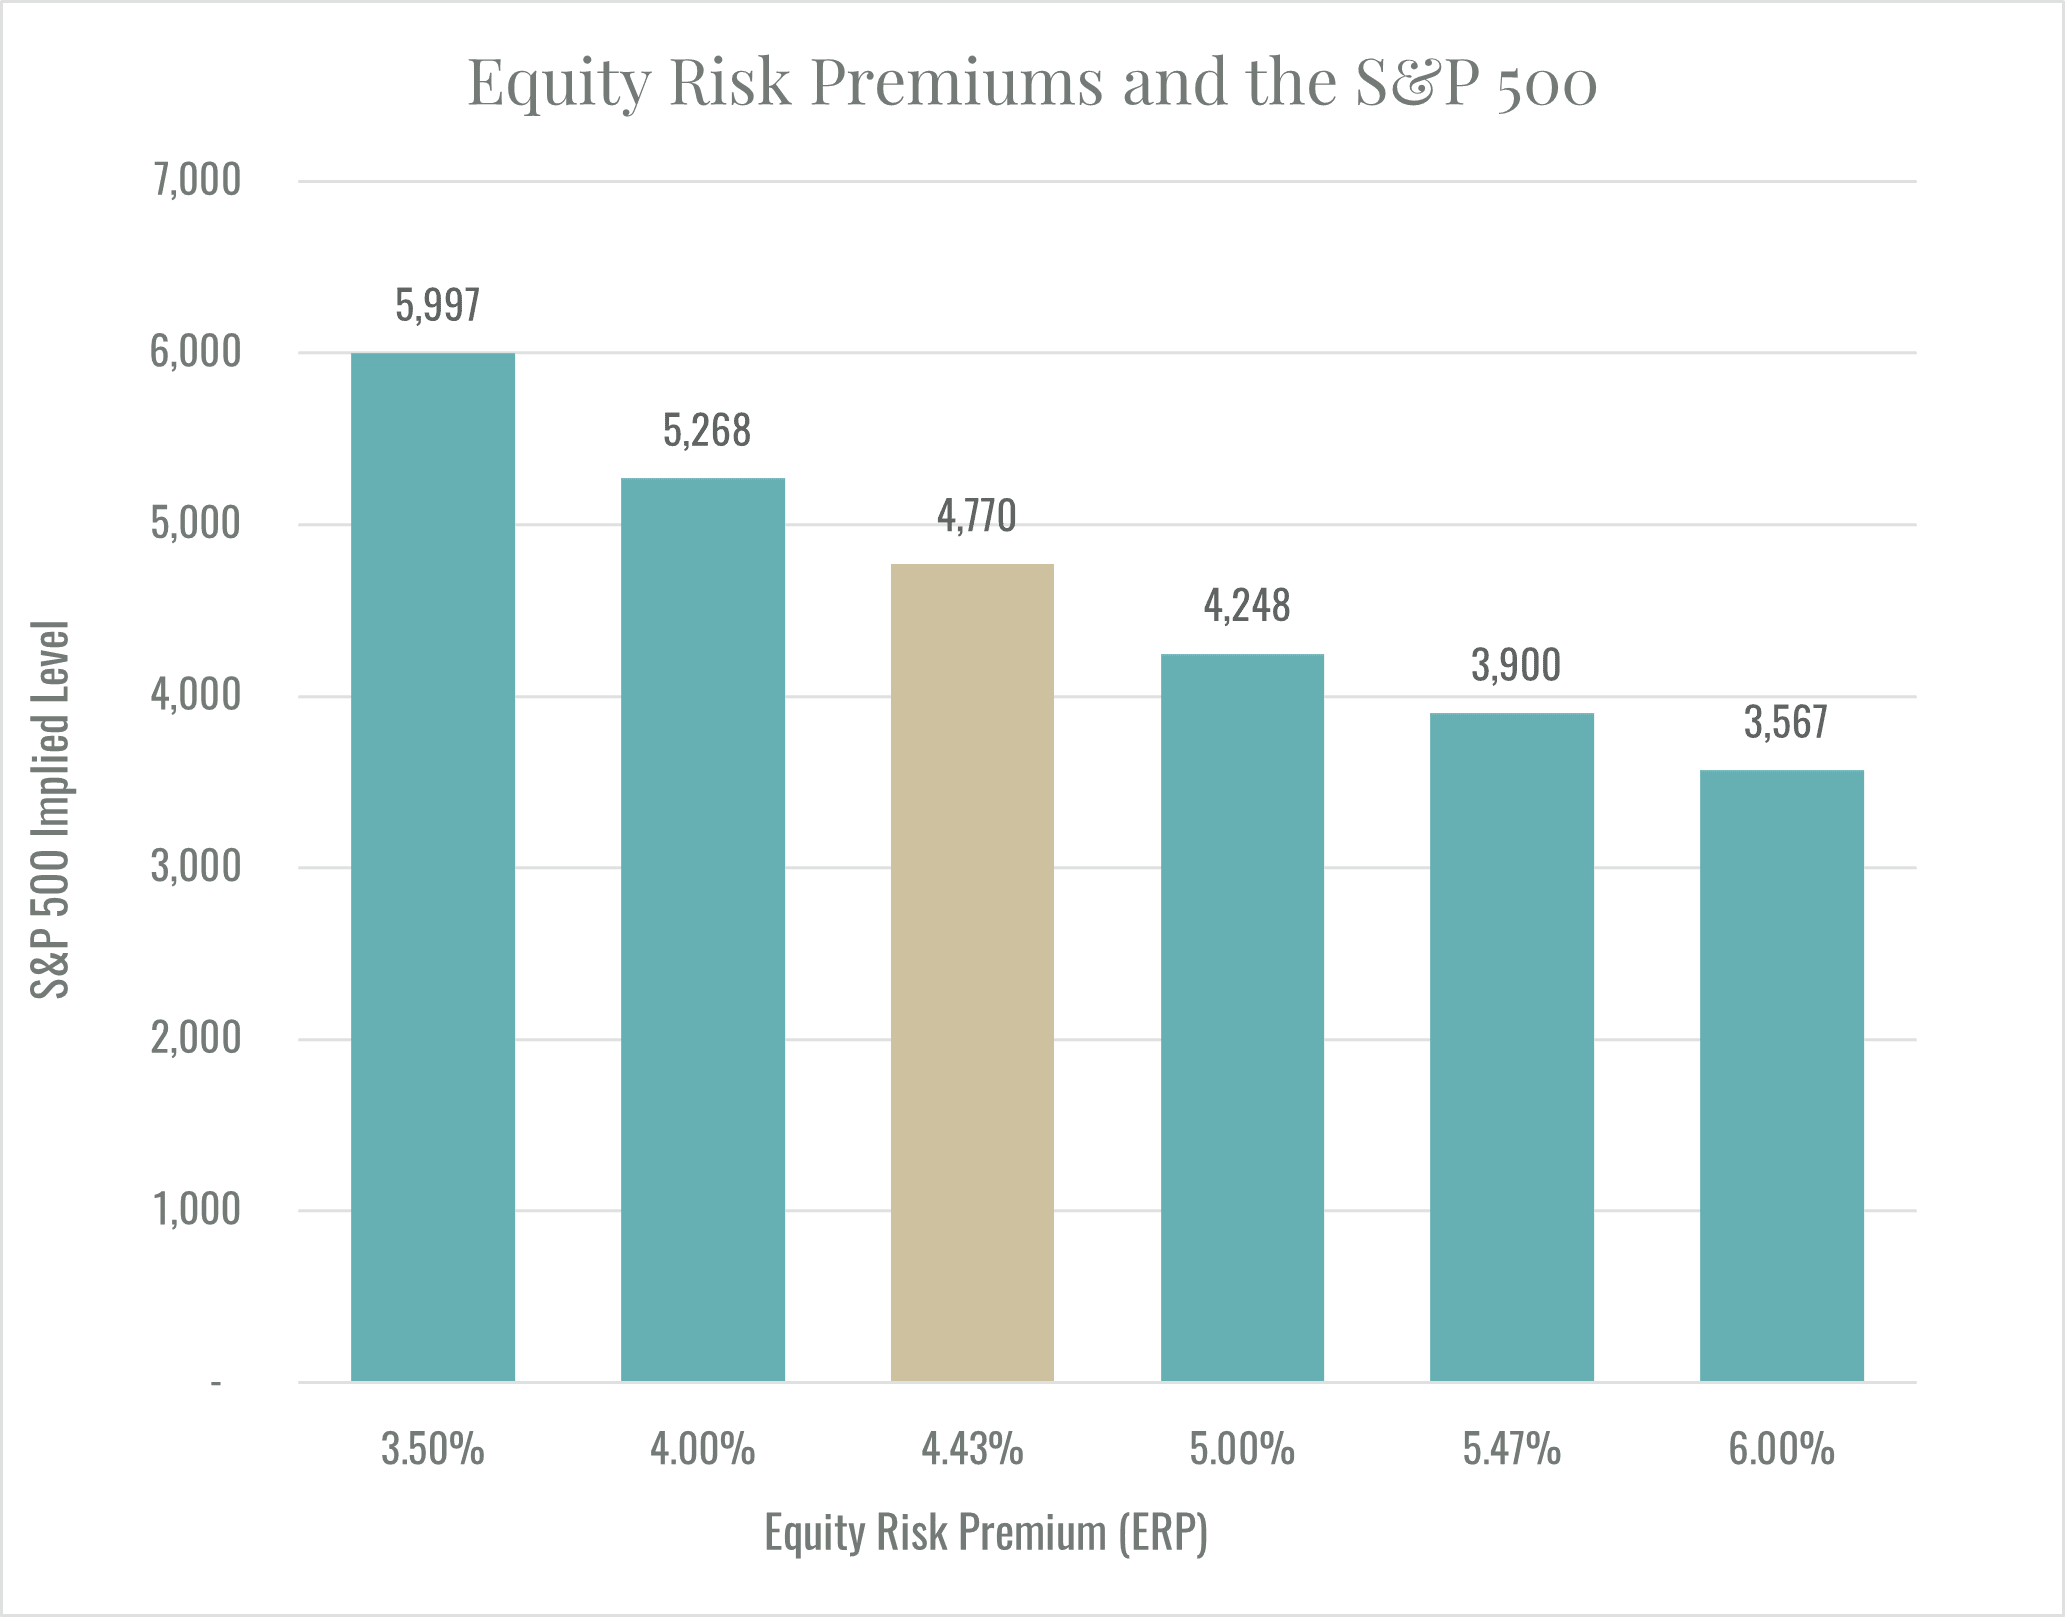
On the other hand, if the premium were to drop to 3.50% the valuation jumps to 5,997. Unfortunately, we believe future increases in the equity risk premium are far more likely than continued declines.
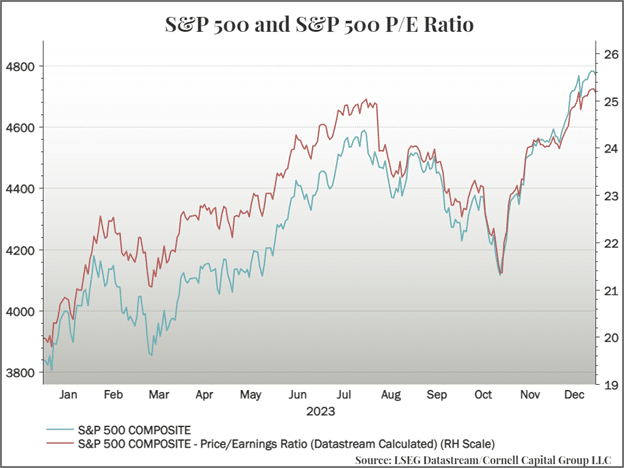
If movements in market prices are due to changes in the equity risk premium, as opposed to rising earnings, then the P/E multiple will expand. This is exactly what happened during the 2023 run-up. As the next chart shows, virtually the entire increase in the S&P 500 can be attributed to a rising P/E multiple. During the fourth quarter, the P/E ratio and the level of the market moved in virtually lock step. Going forward into 2024, the only way for that multiple to expand further, holding expected growth in earnings constant, is for the equity premium to continue to decline. We think this is highly unlikely.
Of course, the equity premium would not be so low, and the level of stock prices would not be so high, if the marginal investor thought that risks were significant. The low premium and high prices are evidence that most investors see smooth sailing ahead. Evidence of this is provided by the behavior of the VIX index, often called the “fear index” because it measures expected market volatility over the next thirty days. As the next chart shows the current VIX index is now near a 15-year low. Apparently, there is currently not much “fear” in the market.

Unpriced Risks?
Risk per se is not a bad thing because markets pay a premium to those who are willing to bear risk. What is a bad thing is bearing risks that are “unpriced” meaning that they are not adequately compensated. Currently, we believe there are risks evidenced by certain key indicators that the market is not properly pricing. That is, in our view, investors are being asked to bear risk without adequate compensation. What follows is a list of what we feel are some major risk indicators that the market has not properly accounted for. The list is not meant to be comprehensive, but it does focus on what we believe are some of the most salient indicators. Taken as whole, they suggest that caution is warranted.
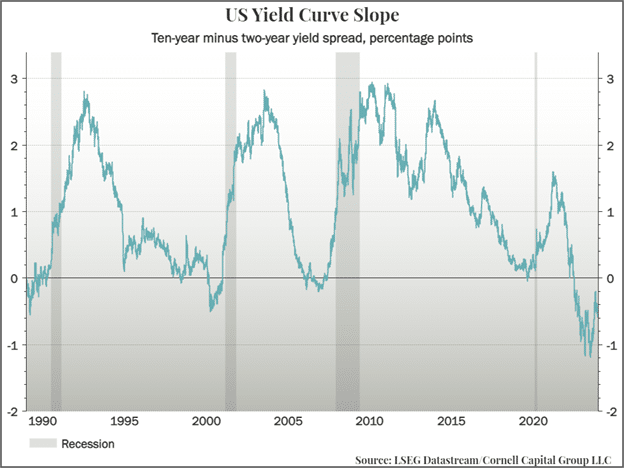
The first indicator is the slope of the yield curve. Extensive research by Campbell Harvey of Duke University and Research Affiliates has revealed that inversion of the yield curve is a particularly accurate predictor of future recessions. One way to measure that inversion is to subtract the yield on 10-year Treasury bonds from the yield on 2-year Treasury bonds. That difference is plotted below along with bars denoting periods of recession. The tea leaves are easy to read. When the curve turns negative, that is when 2-year yields exceed 10-year yields, recessions tend to follow. More precisely recessions tend to occur just after the yield curve begins to un-invert (goes toward 0 in chart). The curve has recently been at its lowest level in the last thirty years but is moving back up.
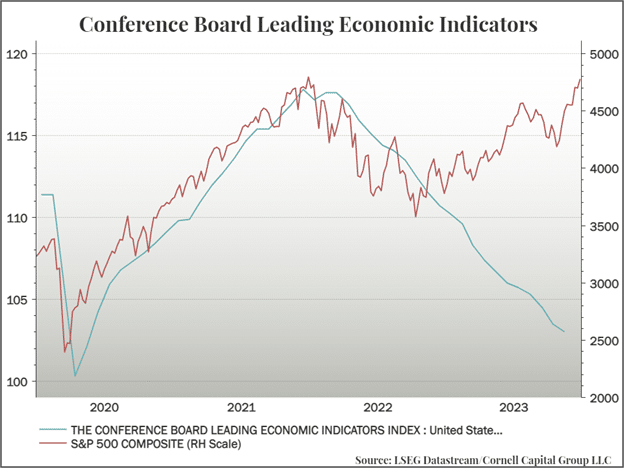
The next indicator is the Conference Board’s Leading Economic Indicators Index. Typically the index moves with the stock market, in part because the S&P 500 is one of the components of the index. That comovement is evident in the chart up through mid-2022. But at that point the leading indicators continue to decline while the market turns up. One wonders how long this divergence can continue. For the gap to close either the leading indicators must improve or stock prices must fall. We fear the latter is more likely.
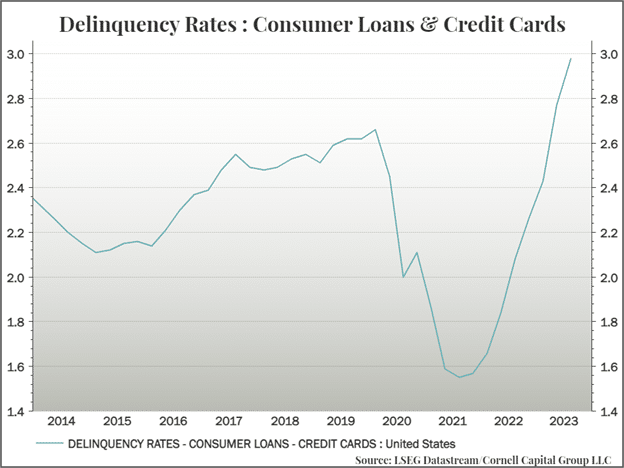
The third indicator is delinquency rate on consumer credit card loans. Consumers played a large role in promoting economic growth in 2023. The rate of delinquencies suggests that the consumer tailwind will diminish, or even reverse, in 2024. Given that the market seems to have priced in continued economic growth in 2024, a slowdown in consumer spending would likely come as a shock to most investors resulting in a drop in stock prices.
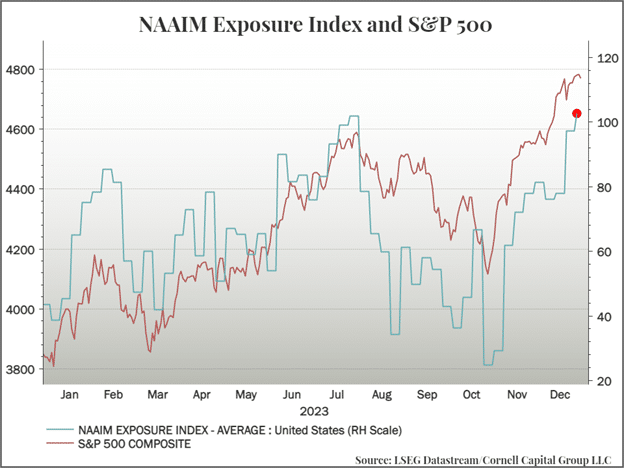
The fourth quarter of 2023 saw a dramatic switch in the behavior of active investment managers. The graph below plots the NAAIM index which measures the exposure of active investment managers to equities. By the start of the fourth quarter, the index was at a year to date low of 25. In the next three months, it skyrocketed to 102. Active managers went from a highly conservative position to going all in on equities. The risk is where can these manager go from there?
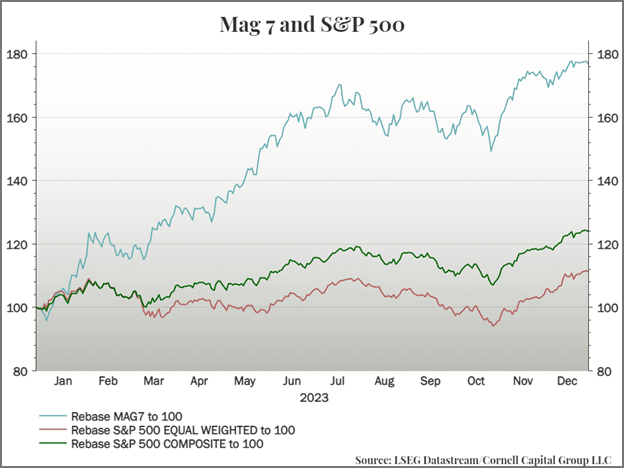
There is one other aspect of the run up in stock prices in 2023 that carries with it a unique risk. Much of the increase in the S&P 500 was due to the performance of seven stocks, the so-called Magnificent 7: Amazon, Apple, Google, Meta, Microsoft, Nvidia, and Tesla. This can be seen in the graph below. Although the S&P 500 ran up 24.8%, much of that gain was due to the Magnificent 7 who rose 76.6% and by the end of the year accounted for more than 30 percent of the index. In contrast, the S&P 500 equal weighted index, which gives little weight to the Magnificent 7, rose only 11.1%. Given their huge market capitalizations, it is hard to see the prices of the Magnificent 7 rising in 2024 anything like they did in 2023. This implies lower market returns overall in 2024.
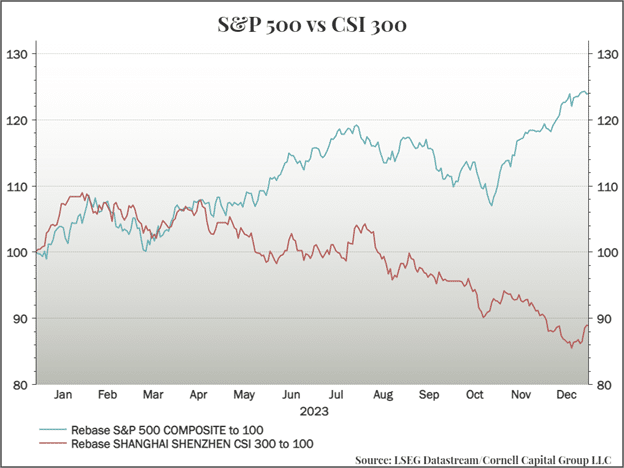
Finally, turning to an international perspective, there can be little doubt that from an investment standpoint the United States currently dominates China. The U.S economy is significantly outperforming China and investors in American companies do not face potential heavy-handed actions by the Chinese Communist Party that can affect the value of Chinese stocks. As is always the case in markets, however, investment decisions cannot be made without reference to prices. A run-down shack may be a better investment than a beach front mansion if the price differential is large enough. And as shown in the graph below, the price differential between American and Chinese stocks widened dramatically in 2023. One must ask whether it is reasonable to believe that this gap will widen further in 2024. If it does not, Chinese stocks, with all their blemishes may be superior investments to US stocks.
Conclusion
The decline in the equity risk premium that we noted in our 3rd quarter memo continued in the fourth quarter, adding fuel to a stock price boom that sent indexes to new records. While the rise in prices was certainly good news for investors, in our view there are downsides. First, low risk premiums imply that future returns are likely to be below historical averages. Second, when risk premiums are low stock prices are more sensitive to changes in the premium. This leads to the possibility of a “trap door” decline in prices if risk aversion suddenly rises pushing the premium up. Apparently, most investors are not too concerned about this possibility because the VIX index is near decade long lows. In addition, active portfolio managers have gone “all in” on common stocks.
We are not so sanguine. In our view there is still a significant chance that the economy will turn down in 2024, if not fall into recession. We also believe that the decline in the risk premium that drove much of the stock market boom in 2023 has reached its limit. If the premium were to return to its historical average in 2024, the result would be a sharp drop in stock prices. Consequently, we plan to be even more cautious and more fully hedged at the start of 2024 than we were at the beginning of the fourth quarter. Of course, this means that if the market continues to charge forward, we will underperform indexes such as the S&P 500, but we feel this is a reasonable price to pay for reducing the risks associated with either a market correction or a slow train to nowhere as the upward momentum comes to an end.
This memorandum is being made available for educational purposes only and should not be used for any other purpose. The information contained herein does not constitute and should not be construed as an offering of advisory services or an offer to sell or solicitation to buy any securities or related financial instruments in any jurisdiction.


