In this video, we explore the history of the CAPE (Shiller PE) ratio, how it’s…
#62 Reflections on Investing : Government Debt and Investing
As Herb Stein “if something cannot go on forever, it will stop”. The current growth of government debt is unsustainable. How will it stop? And what does that mean for investors?
Hello, and welcome back to *Reflections on Investing with the Cornell Capital Group.* Today, we’re going to talk about government debt. Of course, this is a huge topic—one that macroeconomists can spend hours, if not days, discussing. However, what we’d like to do today is highlight some of the key issues for investors. To do that, we’ll start by looking at some very basic data related to government debt. So, without further ado, let’s open the computer and take a look at some of these items.
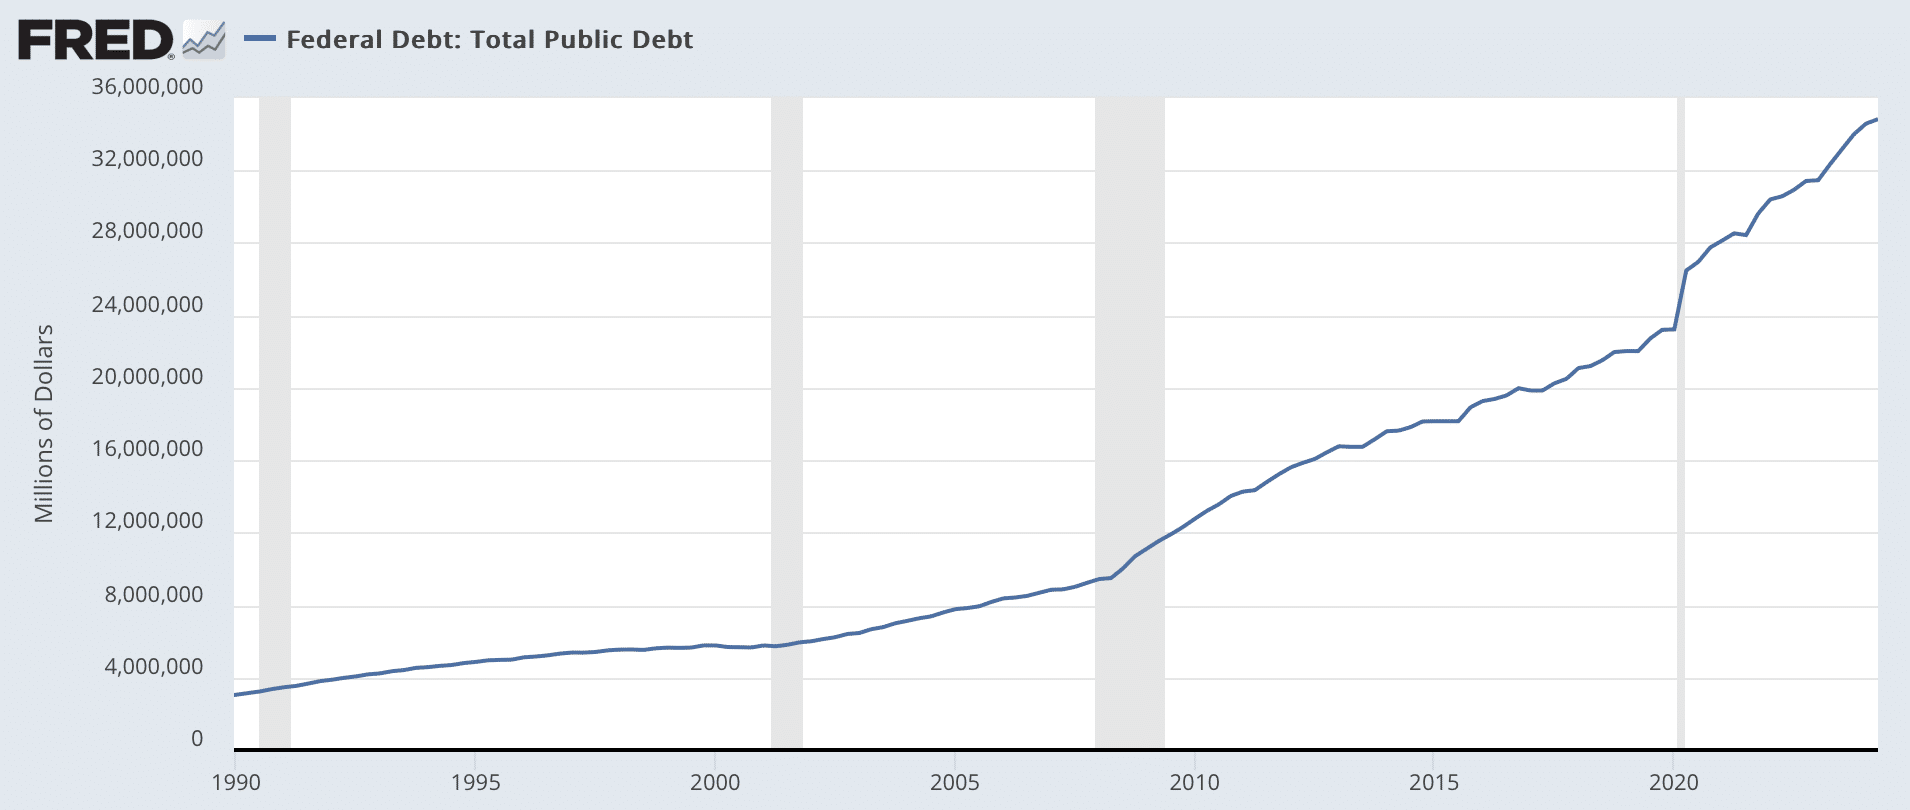
The first chart here shows the current federal debt in trillions of dollars from 1990 to the present. You can see an inexorable rise—not only is it rising, but in recent years, the curve has been getting steeper.
In 1990, government debt was about $3 trillion. Today, it’s around $35 trillion, which is about 100% of GDP. When debt reaches this magnitude, the interest payments on it become very sensitive to interest rate changes.
In recent years, the government has been somewhat bailed out by historically low interest rates—near zero on short-term instruments and only 1-2% on longer-term instruments.
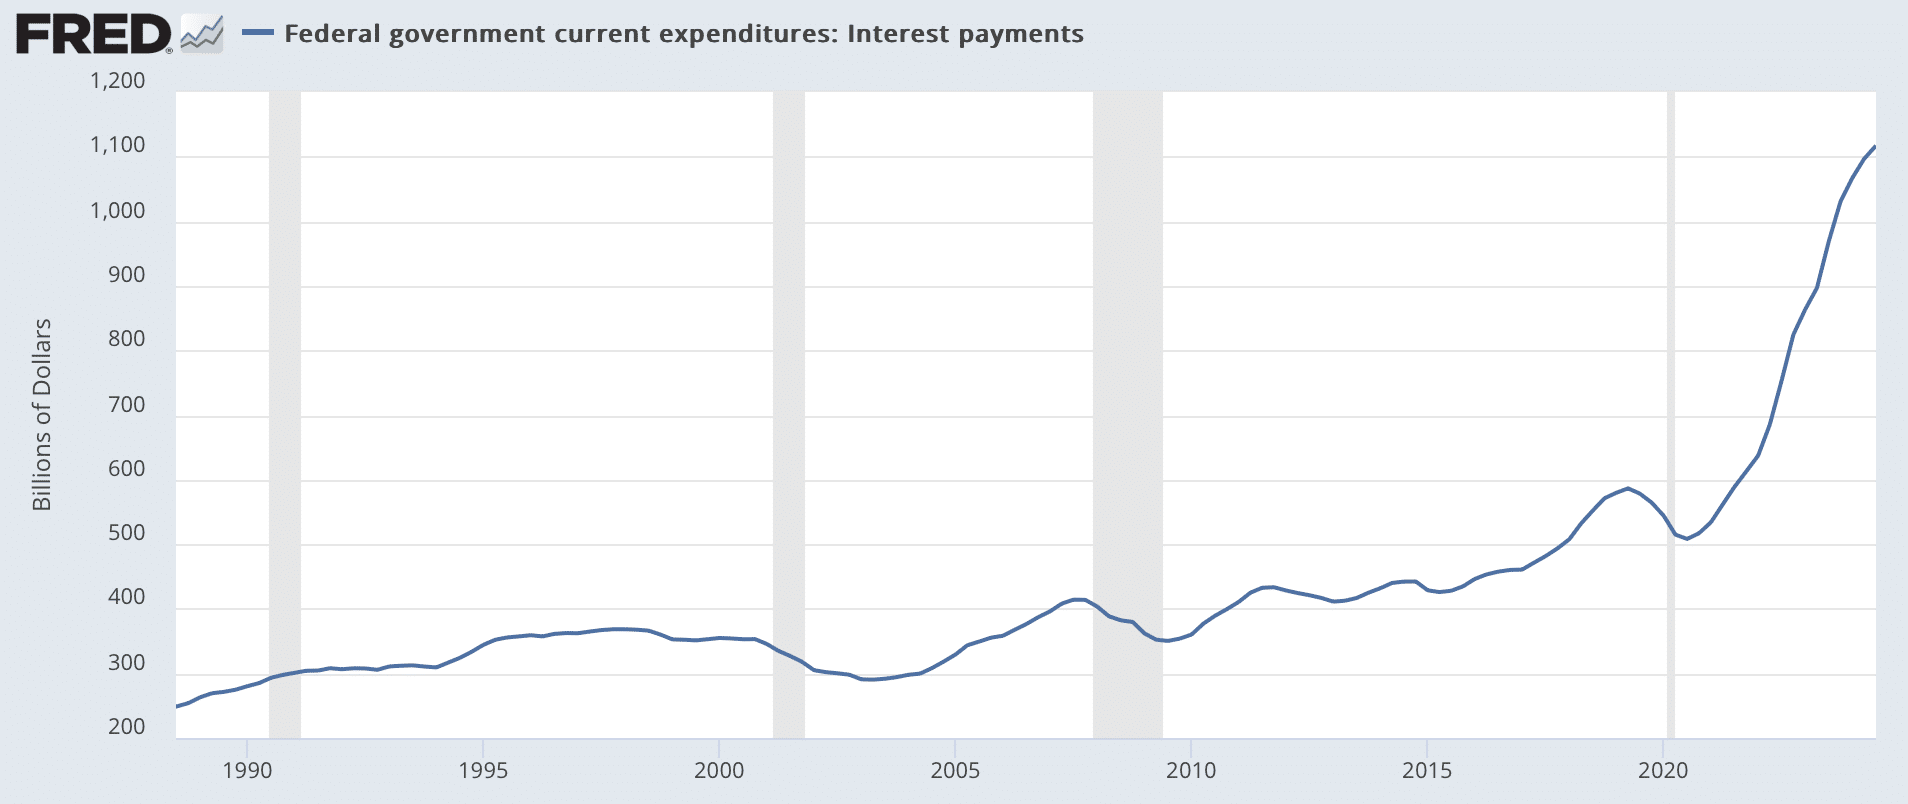
If you plot federal interest rate payments, as shown in the second chart, you’ll see a clear upward trend—from about $270 billion to $1.1 trillion. However, the shape of the curve tells an interesting story.
For an extended period, the curve remained relatively flat while rates were very low. But as interest rates have risen, and as the amount of debt has continued to grow, the interest payments have skyrocketed, reaching the $1.1 trillion level.
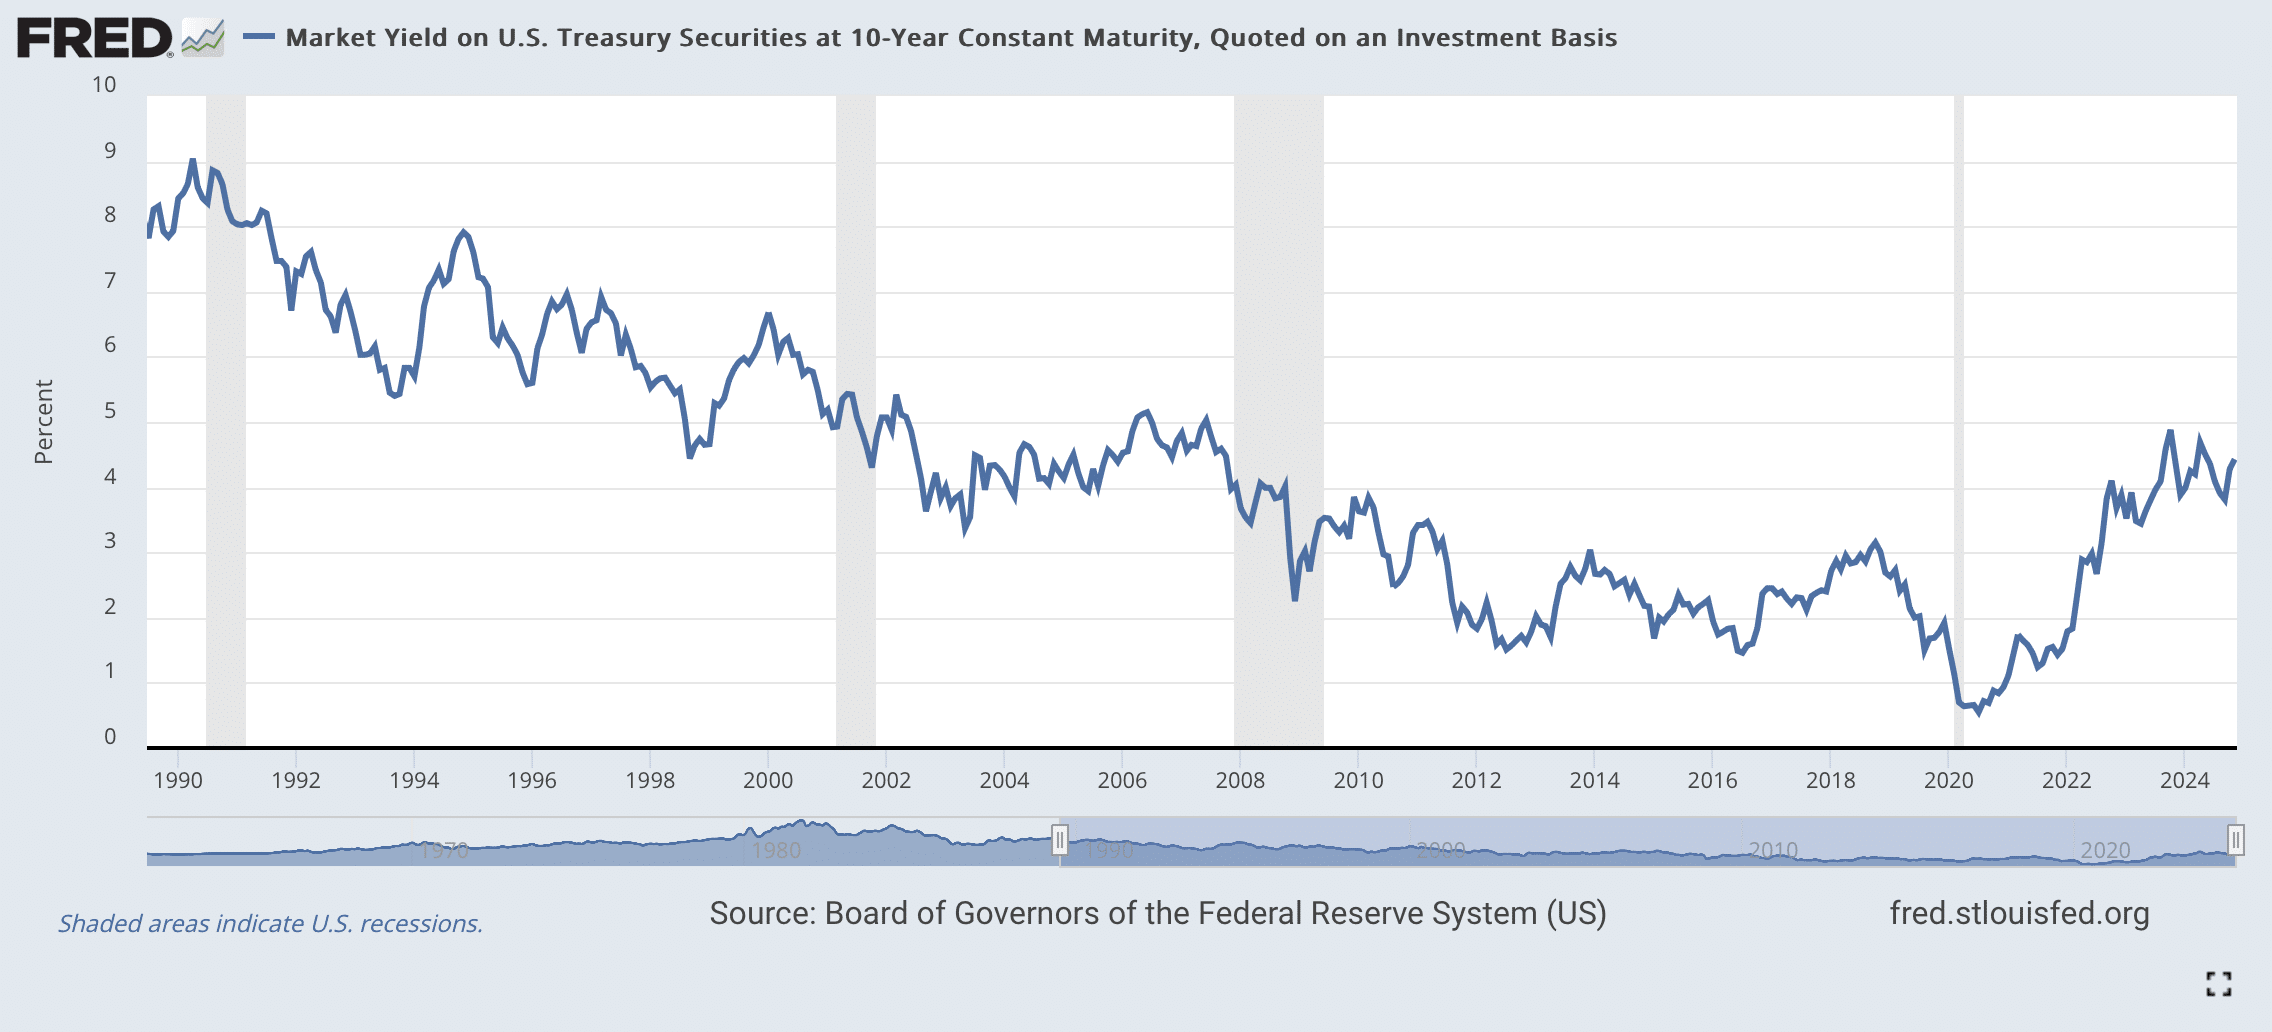
Because interest rates play such a critical role, let’s examine one of the most important rates: the 10-year Treasury yield.
Incidentally, with all the discussions around Federal Reserve policy, it’s worth noting that the Fed only sets the overnight rate. However, what mortgage borrowers, corporations, and other entities care about are longer-term rates. The 10-year Treasury yield serves as a benchmark for those rates.
From 2020, when the 10-year Treasury yield was below 1%, it has since jumped. This chart shows it at 4%, but that’s because these are quarterly data. If I include more recent data, it would show 4.5%.
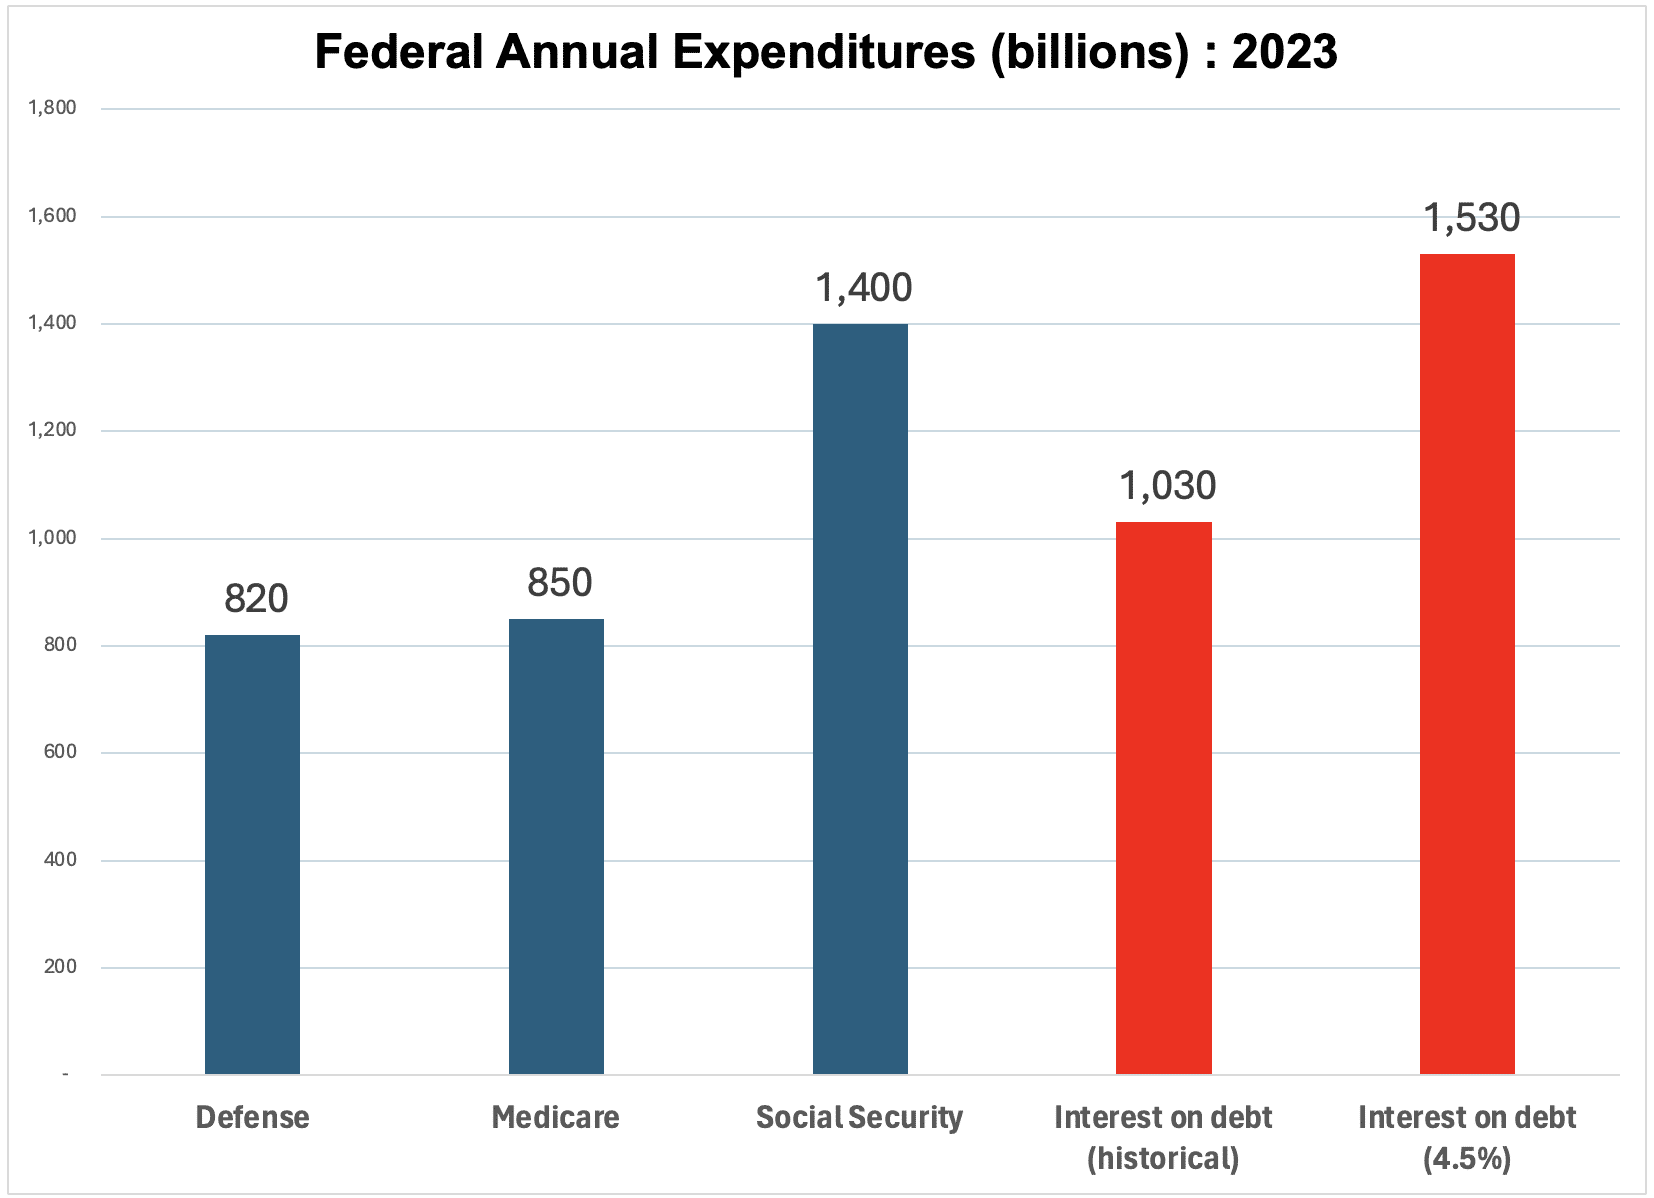
What does all this mean in practical terms? Let’s examine the major categories of federal expenditures in 2023 (for which we have complete data):
- Defense: $820 billion
- Medicare: $850 billion
- Social Security: $1.4 trillion
- Interest Payments: Over $1 trillion
In other words, because debt levels are so high and interest rates have risen, the government’s interest payments are now greater than its defense or Medicare budgets.
And even this is a bit misleading. Many bonds included in that $1.1 trillion figure were issued years ago at lower rates. As these bonds mature and are rolled over at current rates, the interest bill will rise further.
For example, if the federal government were paying 4.5% (roughly the current yield on both short- and long-term government securities) on its entire debt, interest payments would reach $1.5 trillion—exceeding Social Security expenditures.
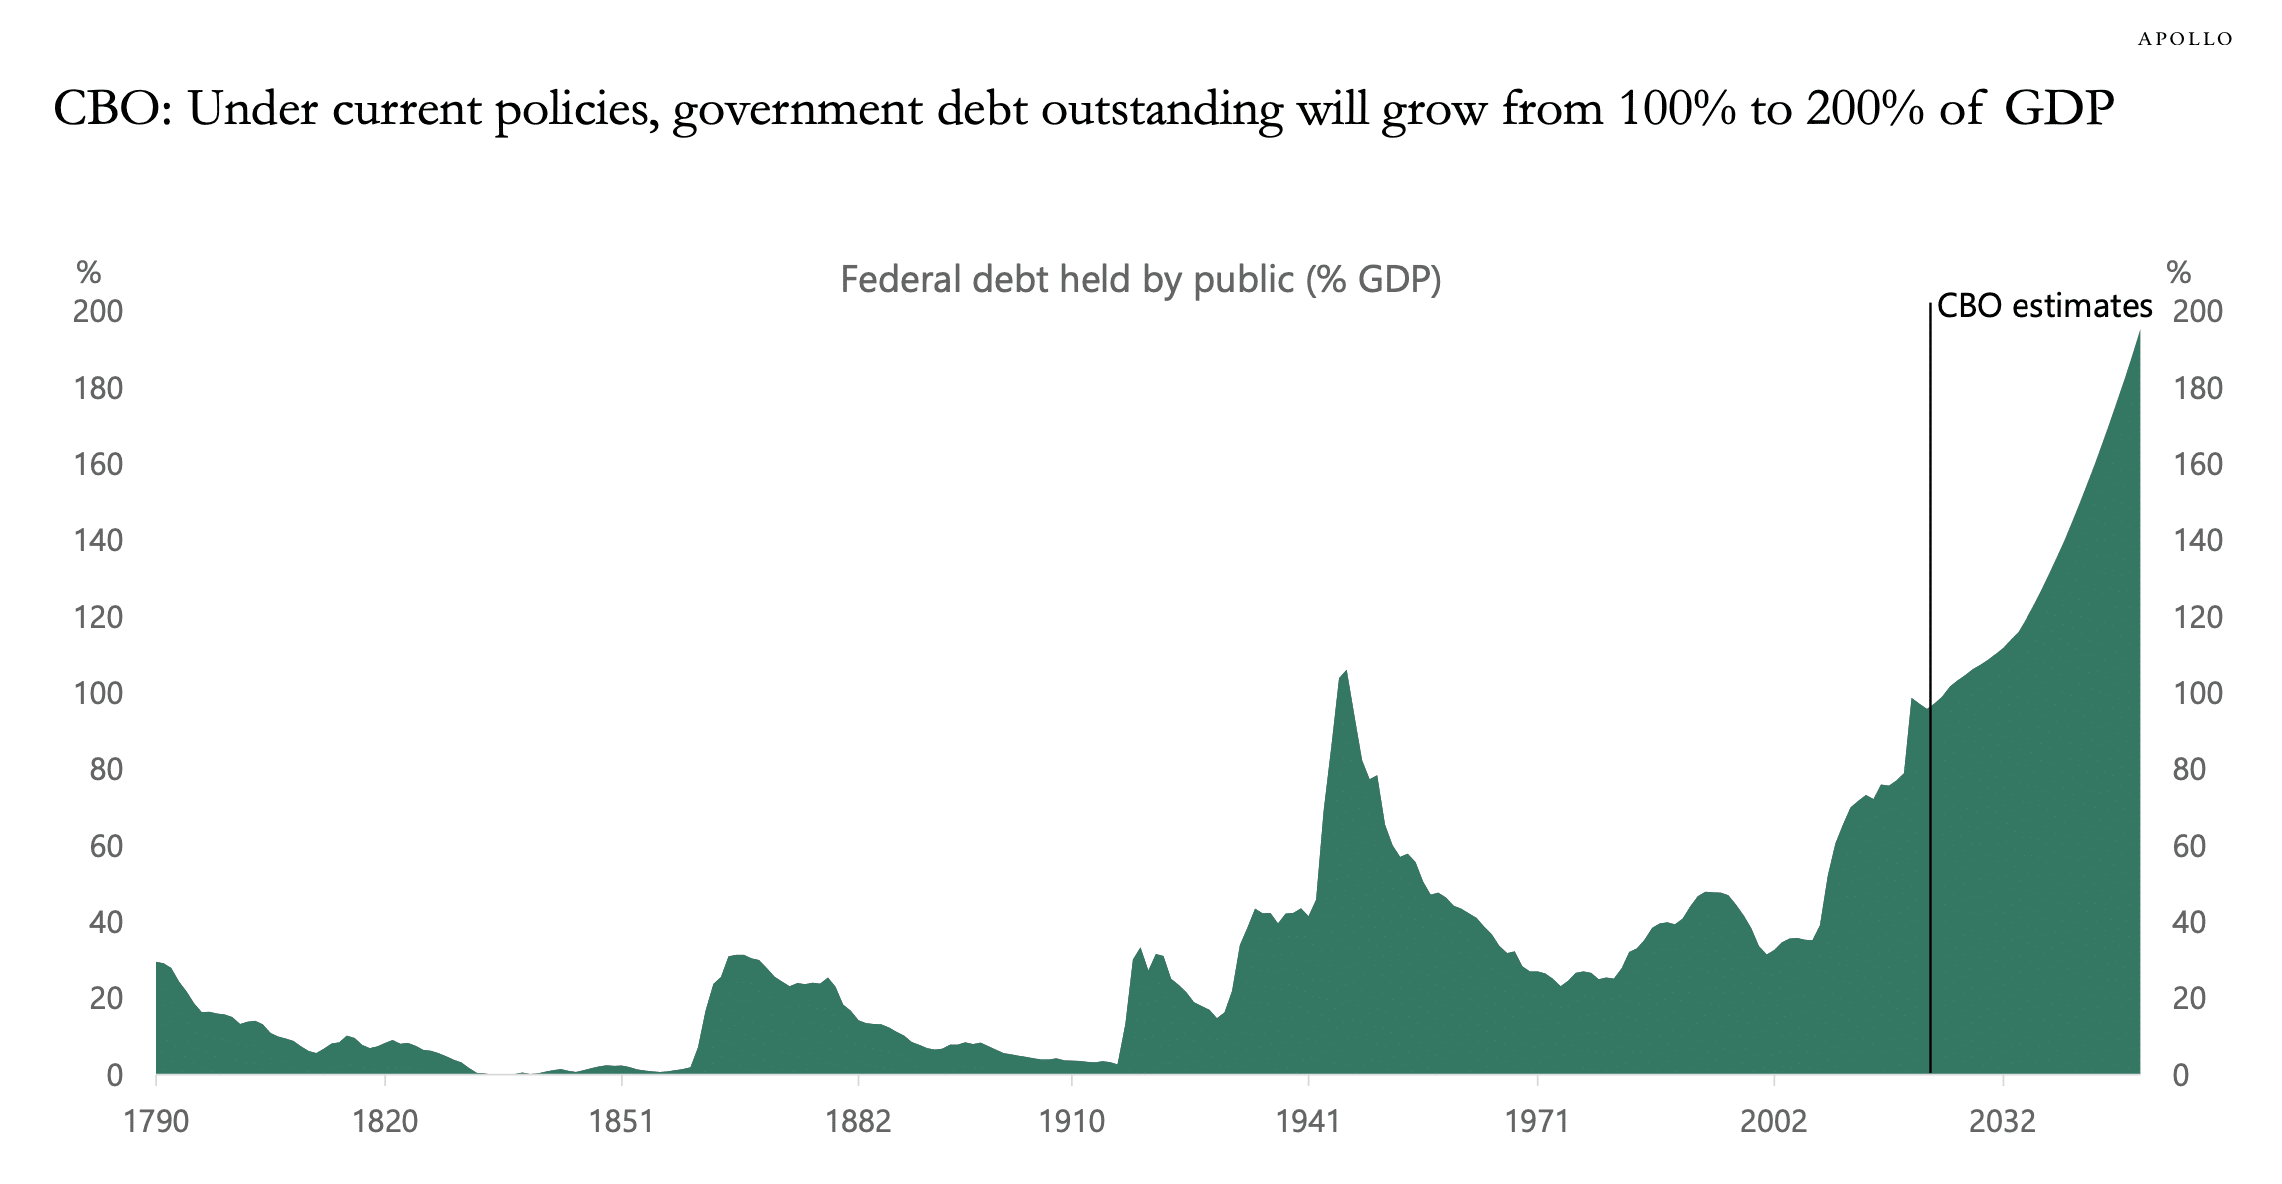
This raises concerns about sustainability. Let’s examine one more chart: projections by the Congressional Budget Office (CBO) for future debt.
Currently, our debt stands at about $35 trillion, or 100% of GDP. According to the CBO, without significant policy changes, this figure is projected to rise to nearly 200% of GDP within a decade.
At some point, interest payments will become so large that they threaten the government’s ability to continue borrowing. Something will have to give. As Herbert Stein famously said, “If something can’t go on forever, it will stop.”
The question is: how will it stop, and what will it mean for you as an investor?
President-elect Trump has recently discussed cutting taxes. However, given the government’s financial position, it’s difficult to see how this would be feasible or wise. In our view at Cornell Capital Group, it might be better for the president to focus on defending the 2017 tax cuts rather than pushing for additional reductions.
Ultimately, the U.S. government and its citizens will need to reach a policy agreement to align tax revenues with expenditures. When they don’t, the only remaining options are borrowing or inflation—neither of which is sustainable in the long term.
For investors, this means watching these developments carefully. Pay particular attention to the 10-year Treasury yield, as it serves as a key indicator. Choose your investments cautiously to minimize potential risks in the event of a financial crisis.


