Stock Price Performance in Review The year 2023 ended on a high note. During the year, the S&P 500 Index rose 24.2% to close the year at 4,769.83. The total return on the index, including dividends, was 26.3%. However, as of December 2023, analysts predicted a more sedate 2024. Exhibit 1 shows the average forecast for
Economic Insights
CORNELL CAPITAL GROUP
Download PDF The implied equity risk premium (IERP) and theories of stock market bubbles both offer explanations for the current elevated level of stock prices, but they are strange bedfellows. Here we explore the relation between the two, starting with the implied equity risk premium. Estimates of the IERP depend on the model used and the
As Herb Stein “if something cannot go on forever, it will stop”. The current growth of government debt is unsustainable. How will it stop? And what does that mean for investors? Hello, and welcome back to *Reflections on Investing with the Cornell Capital Group.* Today, we’re going to talk about government debt. Of course, this
A majority of stocks destroy wealth. In fact, most all of the wealth creation from stocks is attributable to only a handful companies. Today, we’re going to talk about something that is particularly important to investors: corporate value creation. Ultimately, the true hit investments are companies that create very significant value over and above what
Stock Price Performance in Review We begin our Q3 2024 memo with a look back over the last ten years. The chart below plots both the standard S&P 500 index, which is value-weighted, and the equal weighted S&P 500 index over the last decade. The major difference between the two indexes is that large companies in
The combination of P/E multiples and earnings determines stock prices – its basic math. In our last episode of Reflections on Investing we looked at earnings, now we add in the role of the multiple. Hello! Welcome back to Reflections on Investing with the Cornell Capital Group. This week, we’re going to follow up on
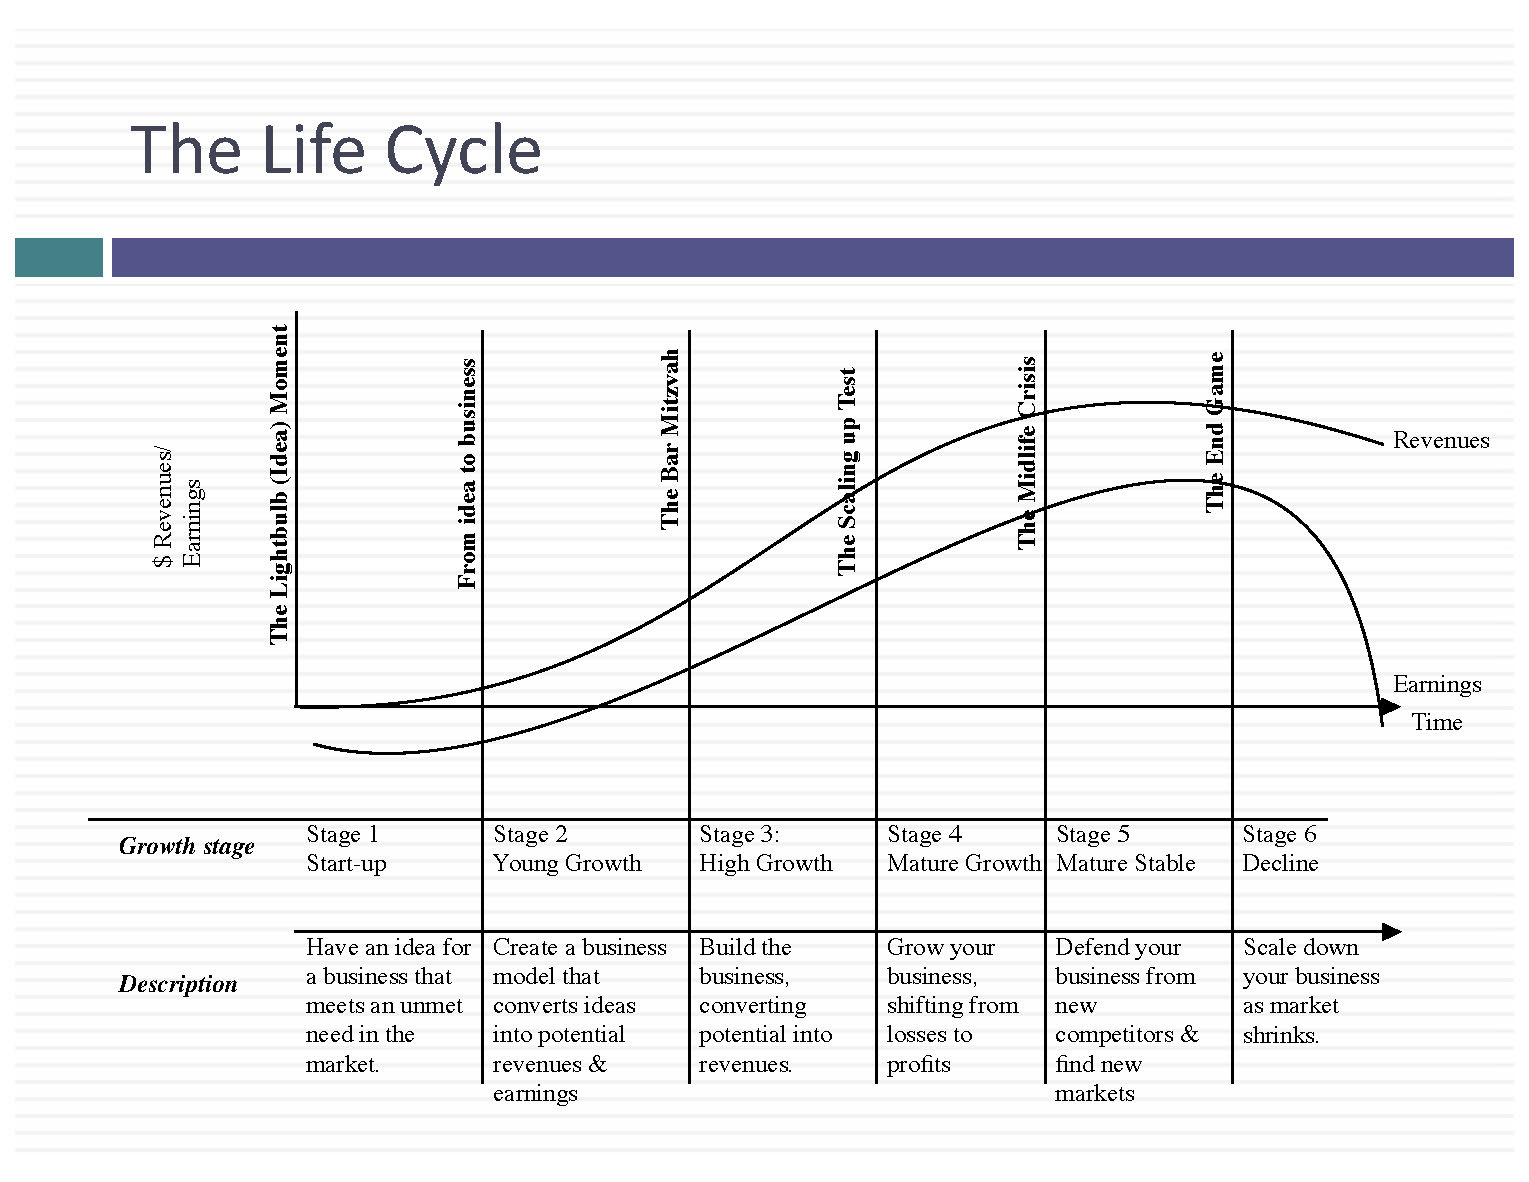
Download PDF Aswath Damodaran writes about what he calls the corporate life cycle.[1] He illustrates the life cycle with the graphic as shown below. From a valuation perspective, Damodaran’s corporate life cycle can be broken down as follows. In the first part, Stage 1 and Stage 2, the company has no meaningful earnings and limited
Page [tcb_pagination_current_page] of [tcb_pagination_total_pages]

